Metrics & Dashboards: open it, first login, settings, fixes
· Updated 18 September 2026 · SparkBox team
Collect time-series metrics with Prometheus and visualize them in Grafana dashboards. See CPU, RAM, disk, network, and per-service metrics across your entire SparkBox in real time. This is the short card for it — the two minutes after you press Enable, and the page to come back to when something is off.
Before you turn it on
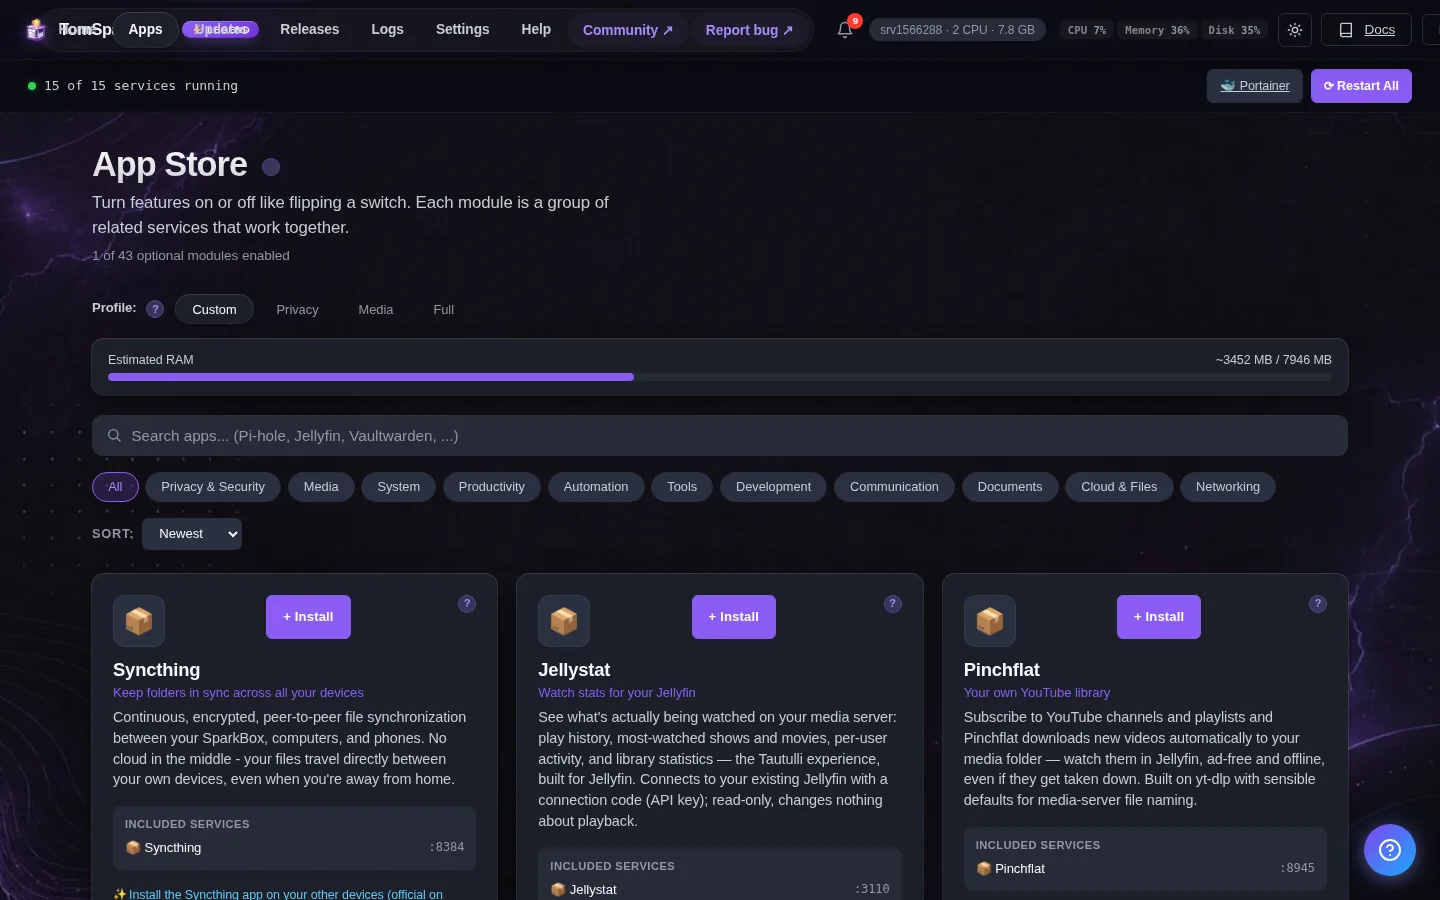
Prometheus scrapes metrics every 15s and keeps 30 days of history. Grafana comes pre-wired to Prometheus and ships with two ready-made SparkBox dashboards - just log in.
Open it
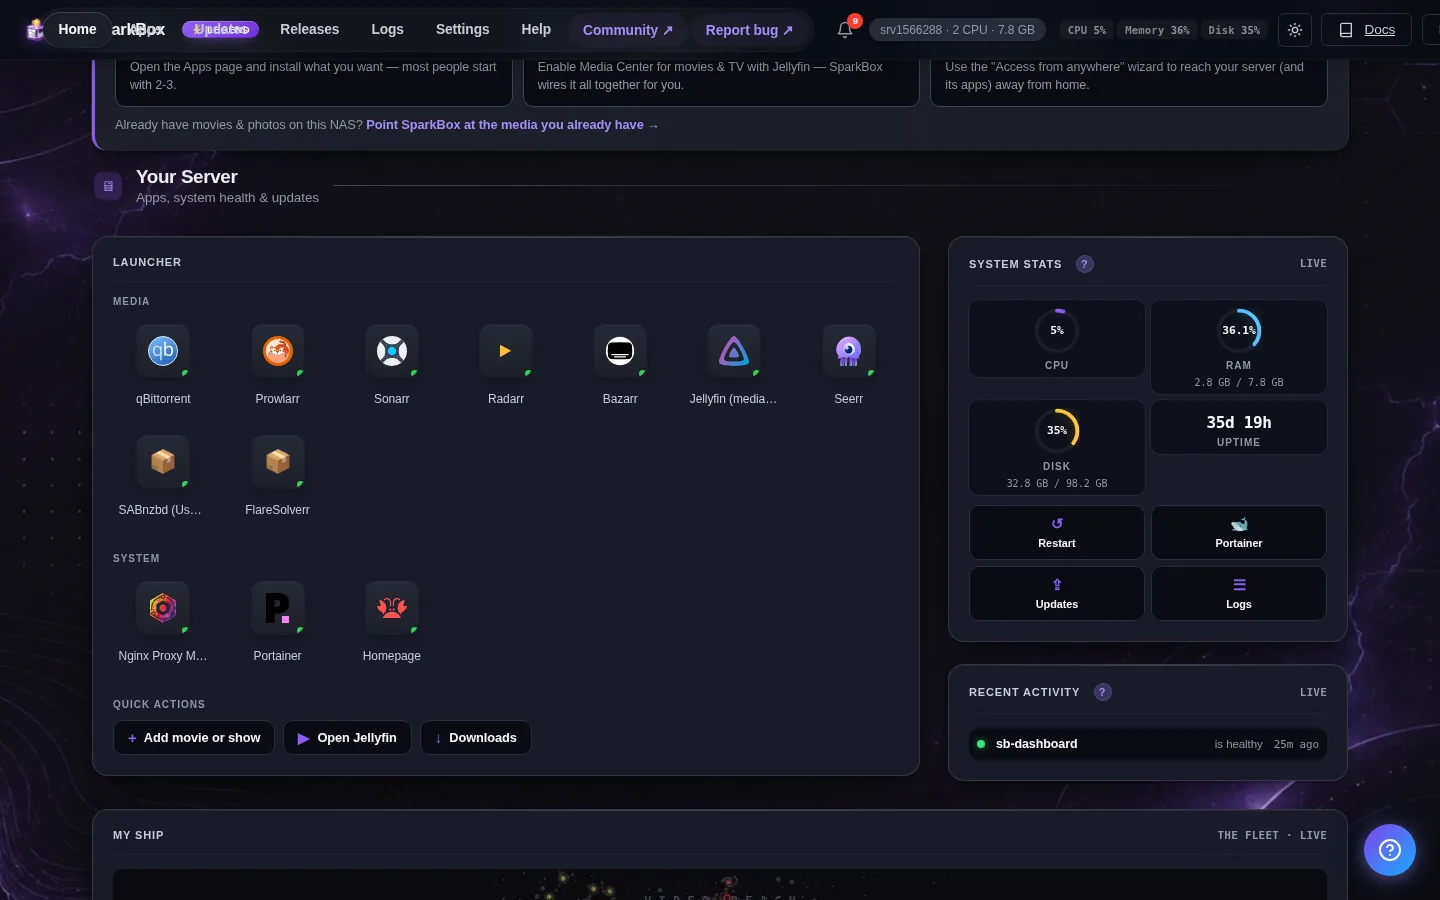
Dashboard → Apps → Metrics & Dashboards → Open. The direct address on your network is:
http://<your-box-IP>:3030Open the SparkBox folder under Dashboards for the ready-made System and Containers views
First login
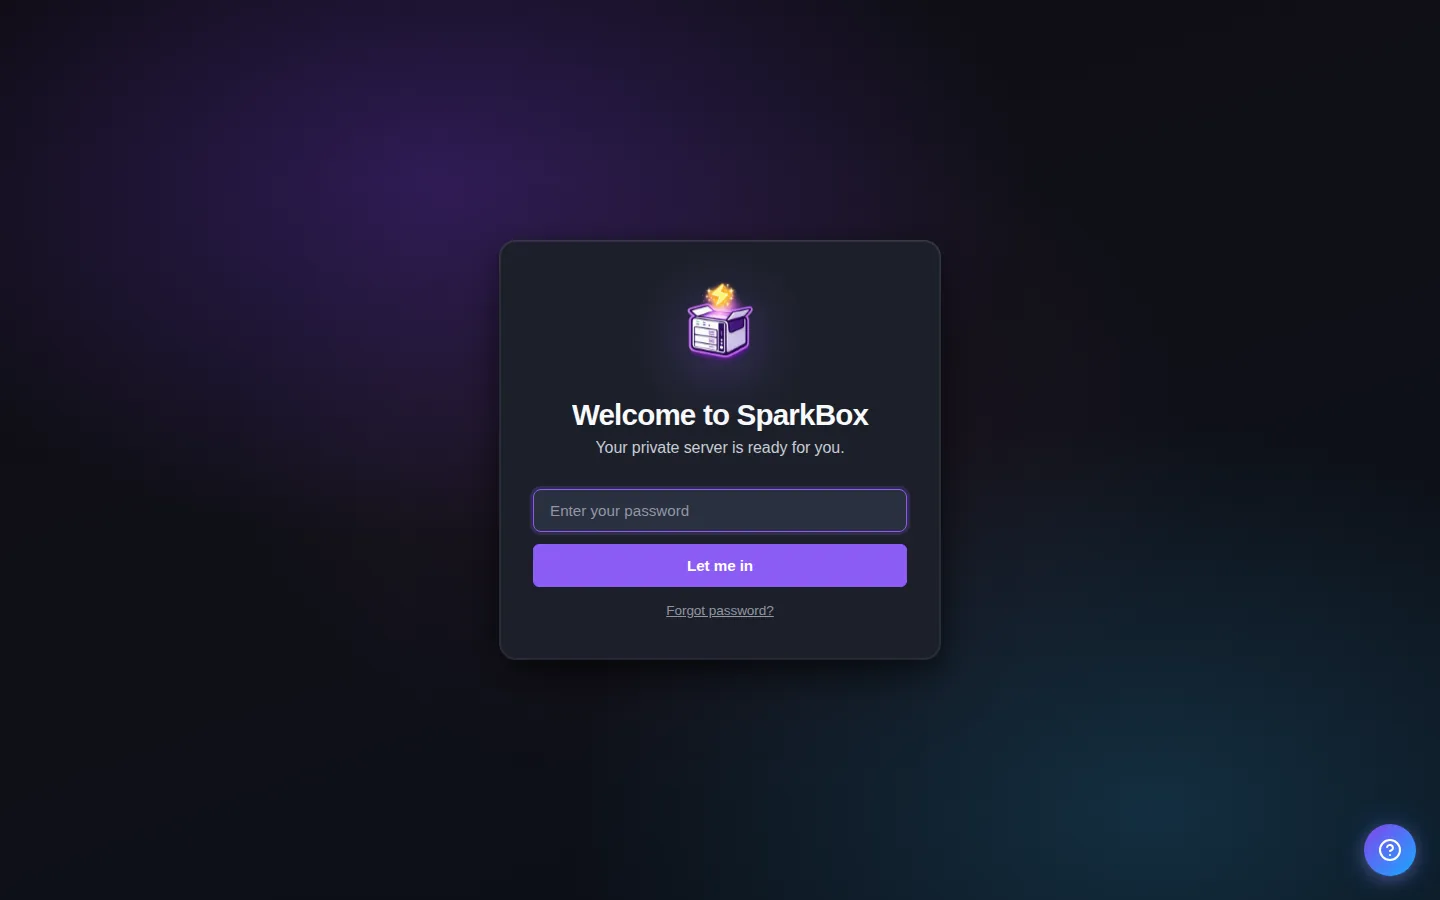
Username: admin — the password was auto-generated for you (Settings -> Service Passwords). Once in, open Dashboards and look in the SparkBox folder.
Any password the installer generated for you is under Settings → Passwords; the Open button offers to copy it.
Settings that matter
Change these under Apps → Metrics & Dashboards (or when you enable it):
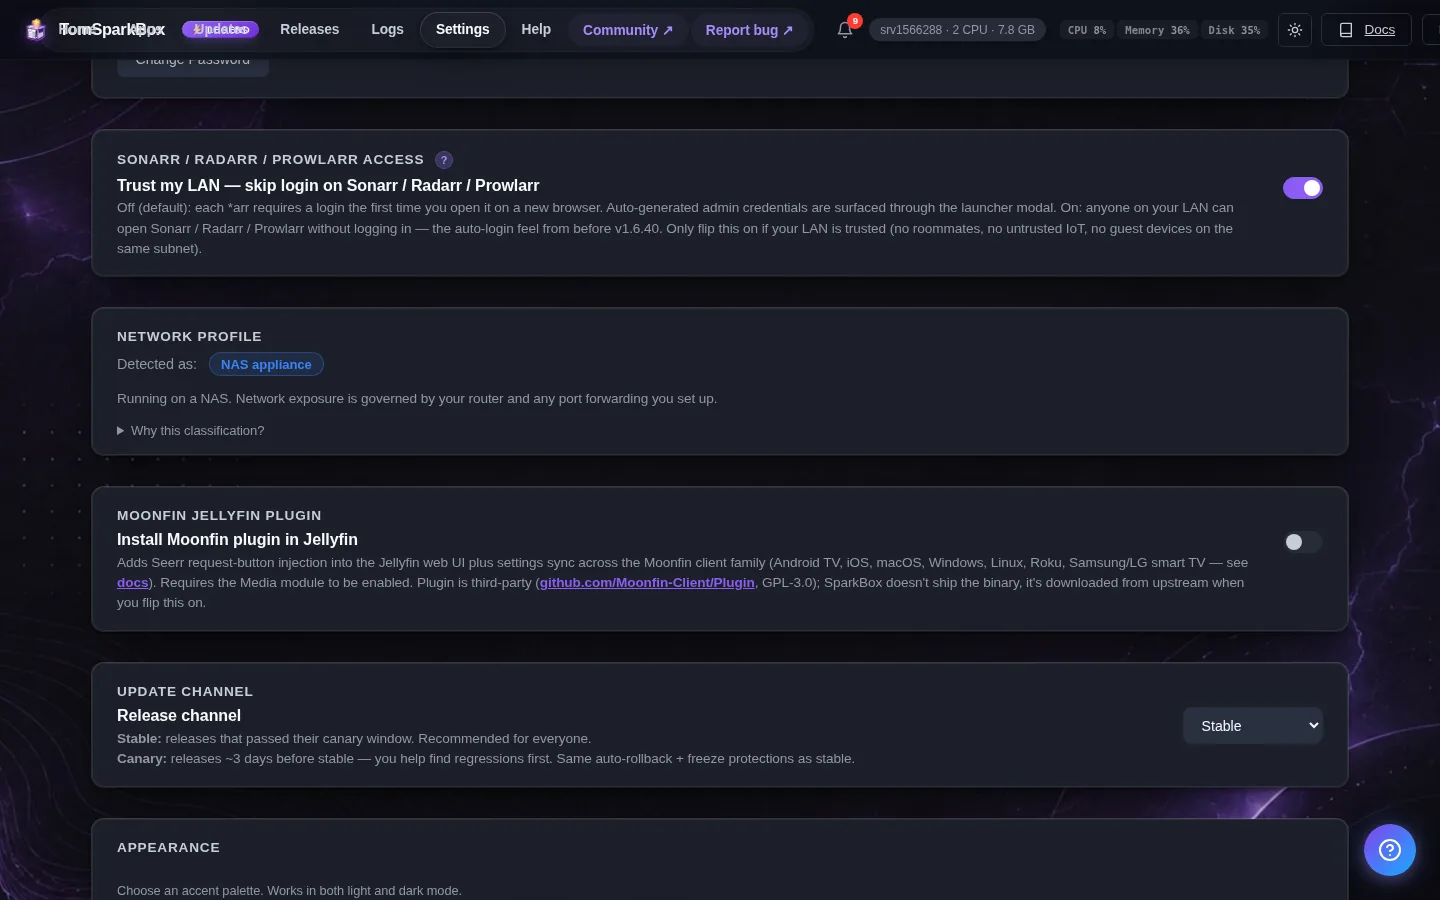
- Grafana Admin Password — Password for the Grafana admin user (auto-generated — see Settings -> Service Passwords)
The two dashboards that come ready-made
Log in to Grafana and open the SparkBox folder (left sidebar, Dashboards). 'SparkBox System' shows your box itself - CPU, memory, every disk including your storage pool, and network. 'SparkBox Containers' shows the same per app, so you can see exactly which container is eating your RAM. Both update every 30 seconds. They're provisioned read-only so updates can improve them - to customize one, open it and use Save As to make your own editable copy.
Adding more dashboards
Grafana's community library at grafana.com/dashboards has thousands of ready-made dashboards. In Grafana go to Dashboards, then New, then Import, and paste a dashboard ID. Dashboards built for 'node-exporter' (try ID 1860) or 'cadvisor' work out of the box because SparkBox already runs both collectors. When the import asks for a datasource, pick Prometheus.
When it breaks
If it will not open, check the app card first — a red dot means it is restarting or unhealthy, and this walkthrough reads the reason from its log. Tom AI on the dashboard can do the same for you.
Where your data lives
/opt/sparkbox/modules/metrics/config/Included in the dashboard's Backup by default. Restoring that backup on a fresh install brings Metrics & Dashboards back exactly as it was.
Questions, or did this not match your box?
Every guide here came from a real problem someone hit. If yours behaves differently, say so — that is how these get corrected, and how the fix gets prioritised.
We answer there rather than in a comment box, because that is where the people who have already solved it are.